
Gemacht Für Industrielle und Wissensbasierte
Mittelständische Unternehmen
Branche
Fertigung & Engineering
Präzisionsfertigung, Automobilzulieferung, Maschinen- & Anlagenbau, Luft- und Raumfahrt- & Verteidigungslieferkette
Wir bauen Steuerungssysteme, die Ihr Unternehmen leichter führbar machen.
Ihre Marge wird entschieden, bevor die erste Maschine startet – in der Kalkulation, im Preis, im zugesagten Liefertermin. Sichtbar wird sie Monate später, wenn der Auftrag längst abgeschlossen ist.
Das eigentliche Steuerungsproblem liegt zwischen diesen beiden Momenten. Die Daten existieren. Aber sie liegen in ERP, Produktionsplanung und Betriebsdatenerfassung, jede mit eigener Logik, und treffen sich erst in einem Rechnungswesen, das in Konten denkt statt in Aufträgen, Maschinen und Produkten. Wir verbinden diese Kette und schaffen Transparenz auf der Ebene von Auftrag, Produkt, Anlage und Kunde – damit Vor- und Nachkalkulation endlich dieselbe Sprache sprechen.
Fertigung

Präzisionsfertigung
Ihr Ergebnis hängt von Maschinenstundensätzen, Rüstzeiten und Ausschuss ab – und davon, welcher Auftrag welche Kapazität blockiert. Konventionelle Gemeinkostenschlüsselung verteilt Kosten dorthin, wo sie nicht entstehen, und erzeugt systematisch falsche Preisentscheidungen. Wir berechnen den Deckungsbeitrag nach Auftrag, Teil und Anlage, machen die Lücke zwischen Angebot und Ist sichtbar und bauen Energie- und Materialkosten mit ihrer realen Volatilität ein. Sie wissen, welche Aufträge Sie annehmen sollten – und welche bei jedem Stück Verlust machen.
Automobilzulieferung
Sie unterschreiben jährliche Preisreduzierungen für Mengen, die niemand garantiert, amortisieren Werkzeuge über Stückzahlen aus dem Nominierungsjahr und leben von Abrufen, die sich wöchentlich verschieben. Wir bauen die Steuerung auf der Ebene, auf der Ihr Geschäft tatsächlich läuft: Ergebnis pro Programm und Plattform über den gesamten Serienlebenszyklus, Break-even inklusive Werkzeug- und Anlaufkosten, die Wirkung von Materialzuschlägen und Indexklauseln, Margenprofil von Serie versus Ersatzteile. Und wir modellieren die Transformation: Verbrenner-Auslauf gegen neuen Programmhochlauf – wann welche Anlage frei wird, was sie bis dahin kostet und wo die Auslastungslücke entsteht.
Maschinen- & Anlagenbau
Projektgeschäft bedeutet, dass Sie das Ergebnis erst erfahren, wenn Sie es nicht mehr beeinflussen können. Wir verlagern die Projektsteuerung nach vorne – Fertigstellungsgrad und erwartetes Ergebnis pro Projekt, Nachträge und Claims als Wert geführt statt als Randnotiz, Gewährleistungsrisiken und Anzahlungen im Cashflow. Dazu die in dieser Branche oft fehlende Sicht: Was verdient Service und Ersatzteilgeschäft auf der installierten Basis tatsächlich, und wie viel Neumaschinen-Marge subventionieren Sie damit still mit? Auftragsbestand, Kapazität und Liquidität gehören in ein Modell, nicht in drei Präsentationen.
Luft- und Raumfahrt & Verteidigung
Programme laufen über Jahrzehnte, Preise fallen entlang vertraglich vereinbarter Lernkurven, und die heutigen Entwicklungskosten werden erst in einem Jahrzehnt zurückverdient – oder nie. Wir bauen die Programmrechnung dafür: Trennung von wiederkehrenden und einmaligen Kosten, Lernkurve gegen die tatsächliche Stückkostenentwicklung, Deckungsbeitrag pro Programm über seine Laufzeit statt pro Geschäftsjahr. Dazu die Themen, die den Sektor derzeit prägen: Kapazitäts- und Investitionsplanung für den Ratenhochlauf, Working Capital in einer Lieferkette mit langen Vorlaufzeiten und die Kostenwirkung von Zertifizierung, Qualitätsanforderungen und Exportkontrolle. Bei Kundenkonzentration auf eine Handvoll OEMs bestimmt eine einzige Ratenentscheidung Ihren gesamten Plan – Sie sollten sie modellieren können, bevor sie eintrifft.
Sehen Sie Ihre Marge, bevor Sie den Auftrag annehmen – nicht erst im Jahresabschluss.
Literaturempfehlung

Das Steuerungsproblem der Luft- und Raumfahrt: Vom Cockpit in den Vorstand
Europa rüstet auf, und Luft- und Raumfahrtunternehmen stehen unter Druck, in einem Tempo zu liefern, für das ihre Planungsstrukturen nie gebaut wurden. In diesem Artikel greift Jaime Andreo auf acht Jahre Erfahrung im Luft- und Raumfahrt-Finanzbereich zurück – einschließlich FP&A-Leitung bei Eurofighter – um zu erklären, warum Standard-Planungsrahmen in diesem Sektor versagen, was die vier strukturellen Herausforderungen sind und was es tatsächlich braucht, um sie zu steuern.
Branche
Energie & Versorgung
Stadtwerke, Netzbetrieb, erneuerbare Erzeugung & Projektentwicklung, Fernwärme & Wasser
Wo wird Ihr Unternehmen morgen Geld verdienen, wenn der Markt sich ständig neu ordnet? Die Energiewende verschiebt Erlöse und Kosten schneller, als konventionelles Reporting folgen kann. Es zeigt Ihnen, was passiert ist – lange nachdem die Entscheidung hätte getroffen werden müssen.
Der Betrieb zählt in Mengen, die Finanzen in Euro, der Markt in den Preisen von morgen. Drei Welten, drei Rhythmen, Lücken dazwischen. Wir schließen sie mit einer Steuerungsbasis, die zeigt, welche Hebel Ihr Ergebnis tatsächlich bewegen – über jede Geschäftseinheit und Tochtergesellschaft hinweg.
Fertigung

Stadtwerke
Sie betreiben faktisch fünf Geschäftsmodelle unter einem Dach: ein reguliertes Netz, ein wettbewerbliches Vertriebsgeschäft, Erzeugung, Wärme – und die strukturell defizitäre Einheit, die über den kommunalen Steuerverbund mitgetragen wird. Die Entflechtung nach § 6b EnWG erzwingt getrennte Konten, liefert aber keine Steuerungssicht. Wir bauen die Ebene darüber: Deckungsbeitrag nach Einheit und Tochtergesellschaft, saubere interne Kostenverrechnung, Konzernplanung gegen Ausschüttungsfähigkeit und Verschuldungsgrenzen. So können Sie dem Aufsichtsrat zeigen, welche Einheit den Konzern trägt – und wie lange die Quersubventionierung die Schwimmbäder noch finanzieren kann.
Netzbetrieb & Regulierung
Ihre Erlöse sind für Jahre festgelegt; Ihre Kosten sind es nicht. Zwischen Basisjahr, Erlösobergrenze, Regulierungskonto und Kapitalkostenanpassung steht Ihr Ergebnis Jahre fest, bevor es in der GuV erscheint – und die Kostenprüfung im Fotojahr wirkt über die gesamte Regulierungsperiode nach. Gleichzeitig treibt der Ausbau die Investitionen: Anschlüsse für Wärmepumpen und Ladeinfrastruktur, § 14a EnWG, Messstellen-Digitalisierung. Wir verbinden Regulierungsrechnung, Investitionsplanung und Finanzplanung in einem Modell, das zeigt, welche Maßnahme anerkennungsfähig ist, wann sie zu Erlösen wird und wie viel Liquidität sie bis dahin bindet.
Erneuerbare & Projektentwicklung
Jedes Projekt eine eigene Gesellschaft, jede Gesellschaft ein eigener Business Case – und irgendwann hat niemand mehr das Gesamtbild. Wir bauen die Portfoliosicht über alle Projektgesellschaften: IRR und DSCR pro Projekt, Plan gegen Ist über den Lebenszyklus, Mittelabfluss über die Pipeline. Auf der Erlösseite rechnen wir ab, was tatsächlich ankommt: Direktvermarktung, PPA-Deckung, entgangene Erlöse in Stunden mit negativen Preisen, Redispatch-Entschädigung. Sie sehen früh, welches Projekt seine Annahmen hält und welches Sie nicht bauen sollten.
Wärme & Wasser
Die größeren Kommunen haben ihre Wärmepläne; die kleineren folgen bis Mitte 2028 – und jeder Plan wird zu einem Investitionsprogramm mit dreißigjährigem Horizont. Wir modellieren es: Anschlussquote und Wärmedichte als Werttreiber, Förderungen im Cashflow, Preisanpassungsklauseln gegen tatsächliche Brennstoff- und Betriebskosten. Auf der Wasserseite führen wir Tarifkalkulation, kalkulatorische Kosten und Anlagenerneuerung in einem Plan zusammen, der auch der kommunalen Prüfung standhält.
Entscheiden Sie, solange Sie noch Handlungsspielraum haben. Wir zeigen Ihnen, wie.
Literaturempfehlung
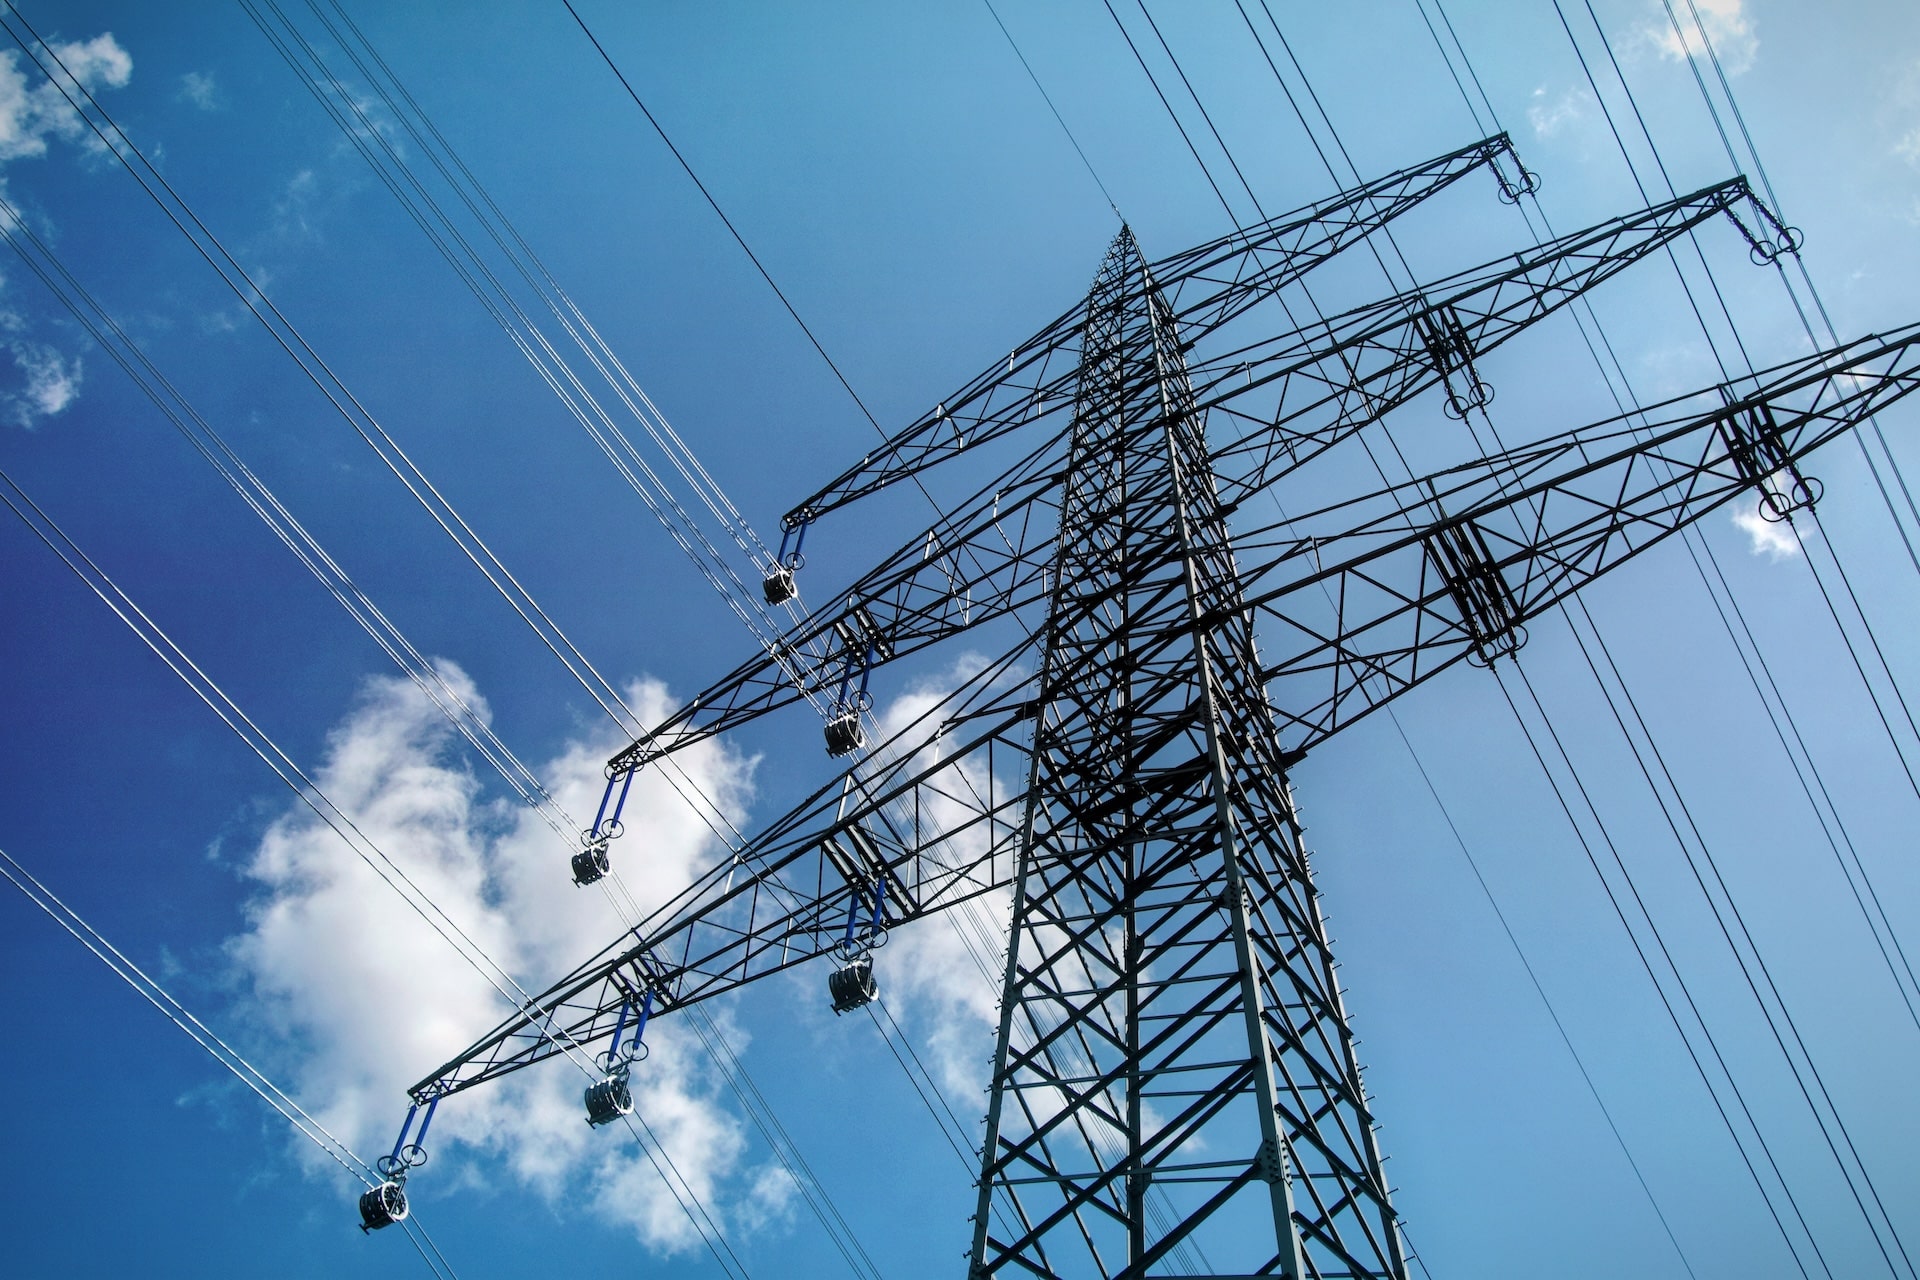
Das Finanzierungsproblem der deutschen Stadtwerke
Stadtwerke besitzen den Großteil der lokalen Strom- und Gasverteilnetze in Deutschland. Von ihnen wird nun verlangt, das Zwei- bis Dreifache ihrer historischen Rate zu investieren. Die meisten können das nicht finanzieren, und die Gründe dafür sind struktureller, nicht zyklischer Natur.
Branche
Telekommunikation & IT
Netzbetreiber & Carrier, Glasfaserausbau & digitale Infrastruktur, IT-Services & Managed Services, Software & SaaS
Wir machen sichtbar, was ein Anschluss, ein Ticket und ein Kunde wirklich kosten.
Ihr Geschäft skaliert in Einheiten – Anschlüsse, Nutzer, Tickets, Instanzen. Ihre Kosten folgen nicht demselben Rhythmus: Sie investieren einmal in ein Netz, eine Plattform oder ein Produkt und verdienen es über Jahre zurück. Ihr eigentliches Steuerungsproblem liegt zwischen dem Moment der Investition und dem Moment, in dem sie sich auszahlt.
Die Daten existieren – in OSS/BSS, Abrechnung, Ticketing, Zeiterfassung und ERP, jede mit eigener Logik und eigenem Zyklus. Wir verbinden diese Kette zu einer Berechnung, die zeigt, was eine Einheit kostet und was sie einbringt: pro Anschluss, pro Service, pro Kunde, pro Vertrag.
Fertigung
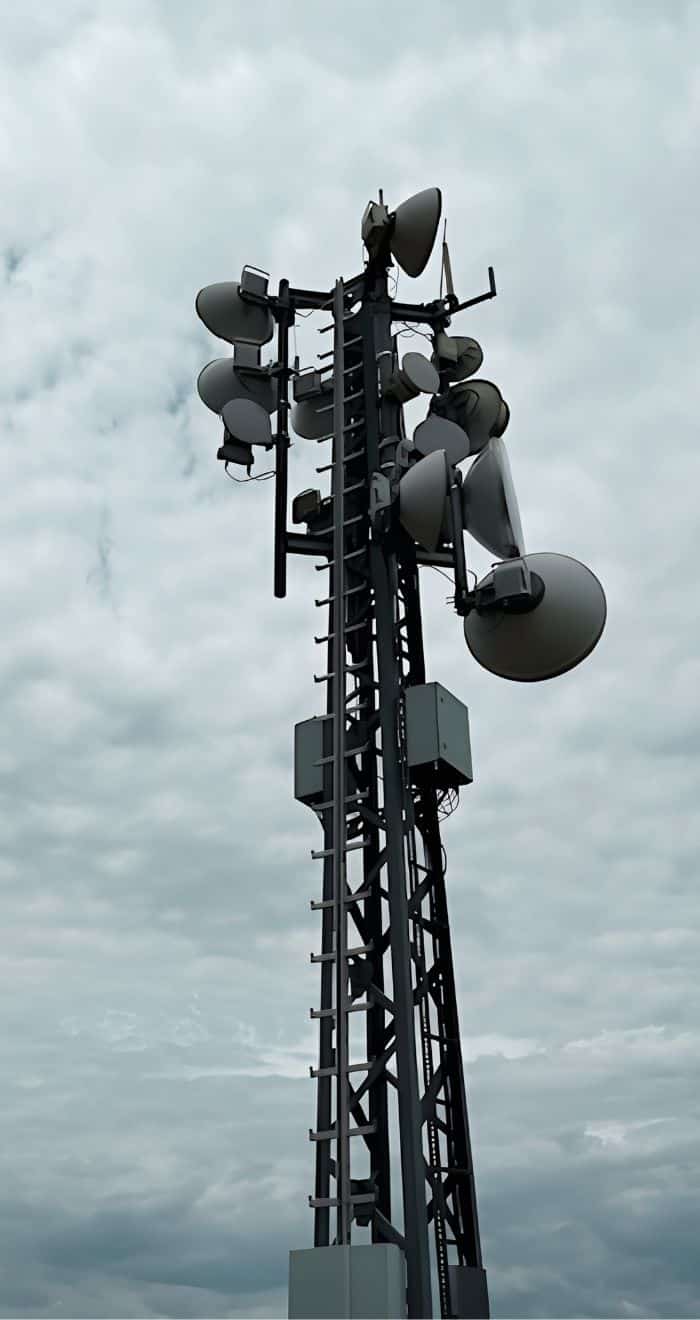
Netzbetreiber & Carrier
Der Umsatz pro Kunde sinkt, das Datenvolumen steigt, und die Netzkosten folgen dem Volumen statt dem Umsatz. Was steuerbar bleibt, sind die Kosten pro Einheit. Wir bauen Stückkostenmodelle, die Netz-, Plattform- und Betriebskosten verursachungsgerecht auf Produkte und Kundensegmente verteilen und sauber trennen, was das Wholesale-Geschäft trägt und was das Retail-Geschäft. Dazu die Berechnungen, die im Standard-Reporting meist fehlen: Deckungsbeitrag nach Kundensegment nach echten Akquisitionskosten, der Business Case für Kupfermigration und Standortstilllegung, Investitionsentscheidungen nach Auslastung statt Abschreibungslogik. Sie sehen, welche Produkte Ihr Netz tatsächlich finanzieren.
Glasfaserausbau & digitale Infrastruktur
Ein Ausbaugebiet ist ein Business Case mit zwanzigjährigem Horizont, und er steht und fällt mit zwei Zahlen: Kosten pro angeschlossenem Haushalt und Take-Rate. Beide werden in der Planung meist optimistisch angesetzt und in der Realität selten erreicht. Wir bauen das Modell, das parallel mitläuft: Plan gegen Ist pro Ausbaugebiet über den gesamten Lebenszyklus, angeschlossene gegen aktivierte Haushalte, Förderungen und Eigenanteil im Cashflow, Marketingausgaben gegen tatsächliche Anschlussquote. Für kommunale Ausbaugesellschaften und versorgergetragene Ventures kommt die Konzernsicht obendrauf: Ergebnis pro Gesellschaft, Ausschüttungsfähigkeit, Finanzierungsbedarf über die Baujahre. Damit zeigen Sie dem Aufsichtsrat, warum ein Gebiet noch trägt – und wann es Zeit ist, nachzuverhandeln.
IT-Services & Managed Services
Sie verkaufen Verfügbarkeit; Sie haben Aufwand kalkuliert. Beides driftet auseinander, sobald der Vertrag läuft: Ticketvolumen steigen, vertragliche Preisreduzierungen greifen, Übergangskosten wurden nie sauber getrennt. Wir machen die Vertragsmarge über die Laufzeit sichtbar statt als Jahresdurchschnitt – Ergebnis pro Vertrag und Service, Kosten pro Ticket und pro gemanagter Einheit, Auslastung gegen die Rate Card, die Wirkung von SLA-Strafen und Liefermix. Und wir bringen dieselbe Logik in die Angebotsphase: Wer seine echten Stückkosten kennt, kalkuliert Ausschreibungen anders – und weiß, wo die Schmerzgrenze liegt, bevor er unterschreibt.
Rechenzentren & Cloud-Infrastruktur
Sie verkaufen faktisch Kapazität in Kilowatt, kalkulieren aber oft noch in Quadratmetern und Racks. Ihre größten Hebel liegen zwischen kontrahierter, installierter und tatsächlich gezogener Leistung – ebenso wie Ihr teuerster Planungsfehler, wenn Kapazität reserviert und ungenutzt bleibt. Wir bauen die Berechnung pro Kilowatt und pro Kunde: Betriebskosten inklusive Strom, Kühlung und Wartung, Auslastung gegen die Kosten der Kapazitätsvorhaltung, die Wirkung von Preisanpassungsklauseln und Energiebeschaffung auf die Vertragsmarge. Dazu die Themen, die den Markt derzeit treiben: Investitionsfälle pro Bauphase mit Netzanschluss und Time-to-Power als kritischem Pfad, höhere Rack-Dichten und Kühlkonzepte für KI-Workloads sowie die Anforderungen des deutschen Energieeffizienzgesetzes – PUE, Abwärmenutzung und Berichtspflichten sind längst keine reinen Engineering-Themen mehr, sondern Kostenpositionen und Investitionsauslöser. Auf der Cloud-Seite schaffen wir die intern meist fehlende Kostentransparenz: verursachungsgerechte Zuordnung von Cloud-Ausgaben zu Anwendungen, Produkten und Geschäftseinheiten und einen belastbaren Vergleich über Cloud, Colocation und On-Premises über die gesamte Nutzungsdauer – inklusive der Migrations- und Repatriierungskosten, die solche Vergleiche üblicherweise auslassen.
Zählen Sie in Einheiten, bevor der Markt es für Sie tut.
Branche
Dienstleistungen, Gesundheitswesen & Bildung
Beratungs- & Ingenieurdienstleistungen, Gesundheitswesen & Krankenhäuser, Bildungs- & Forschungseinrichtungen, kirchliche & gemeinnützige Organisationen
Wir bauen Steuerungssysteme, die Ihre Organisation leichter führbar machen.
In Dienstleistung, Gesundheitswesen und Bildung ist Ihr größter Kostenblock zugleich Ihre einzige Kapazität: Ihre Mitarbeiter. Sechzig bis achtzig Prozent der Kosten stecken im Personal – und die Erlösseite haben Sie meist nur teilweise in der Hand. Was steuerbar bleibt, ist, wo Ihre Stunden landen. Die Wahrheit steckt in Ihren Daten. Aber jede geleistete Stunde durchläuft Dienstplanung, Zeiterfassung und Rechnungswesen, bevor sie im Ergebnis ankommt. Wir verbinden diese Kette und schaffen Transparenz auf der Ebene von Einheit, Team und Service – in der Sprache Ihrer Branche.
Fertigung

Beratungs- & Ingenieurdienstleistungen
Sie verkaufen Zeit, und was zählt, ist, wie viel davon beim Kunden ankommt. Wir machen Auslastung, Projektmarge und unberechnete Stunden auf Projekt-, Team- und Kundenebene sichtbar und koppeln die Prognose an Pipeline und Verfügbarkeit statt an das Bauchgefühl zum Quartalsende. Sie sehen früh, welche Mandate Sie ausbauen und welche Konditionen Sie neu verhandeln sollten.
Gesundheitswesen & Krankenhäuser
Ihre Erlöse folgen Fallzahl, Case-Mix und Pflegebudget – Ihre Kosten folgen dem Dienstplan. Wir führen beides in einer Berechnung zusammen: Deckungsbeitrag nach Abteilung, Personalbesetzung gegen regulatorische Mindestquoten und die Budgetwirkung der Verlagerung zur ambulanten Versorgung und der Leistungsgruppenzuordnung. Der Monatsabschluss wird zum Steuerungsinstrument statt zur Rückschau. Bildungs- & Forschungseinrichtungen: Grundfinanzierung, Drittmittel und Studiengebühren folgen jeweils eigener Logik, und jeder Geldgeber rechnet anders ab. Wir bauen eine einheitliche Sicht, die Forschungsprojekte, Lehrkapazität und Personalbesetzung zusammenführt – inklusive Vollkosten pro Projekt und Verwendungsnachweis-Tracking. Sie wissen, welche Projekte sich selbst tragen und wo Sie Kapazität aufbauen können, bevor die nächste Antragsrunde beginnt.
Kirchliche & gemeinnützige Organisationen
Über Jahrzehnte gewachsene dezentrale Strukturen, Refinanzierung über Pflegesätze und Entgelte – und mit jeder Tarifrunde steigen die Personalkosten schneller als die Erlöse. Wir konsolidieren die einzelnen Einheiten zu einem Bild auf Konzernebene: Ergebnis pro Einheit, zweckgebundene Mittel, Rücklagen. Damit können Sie Entscheidungen begründen, ohne die lokale Autonomie infrage zu stellen.
Sehen Sie, wo Ihre Stunden Wert schaffen – und wo sie still versickern.